

Small business owners often have access to financial data—but not financial clarity.
Many businesses generate reports every month through accounting software like QuickBooks or Xero, yet very few owners consistently use that information to guide strategic decisions. Instead, they operate reactively: checking bank balances, scrambling during tax season, or trying to solve cash flow problems after they already exist.
This is where financial dashboards become extremely valuable.
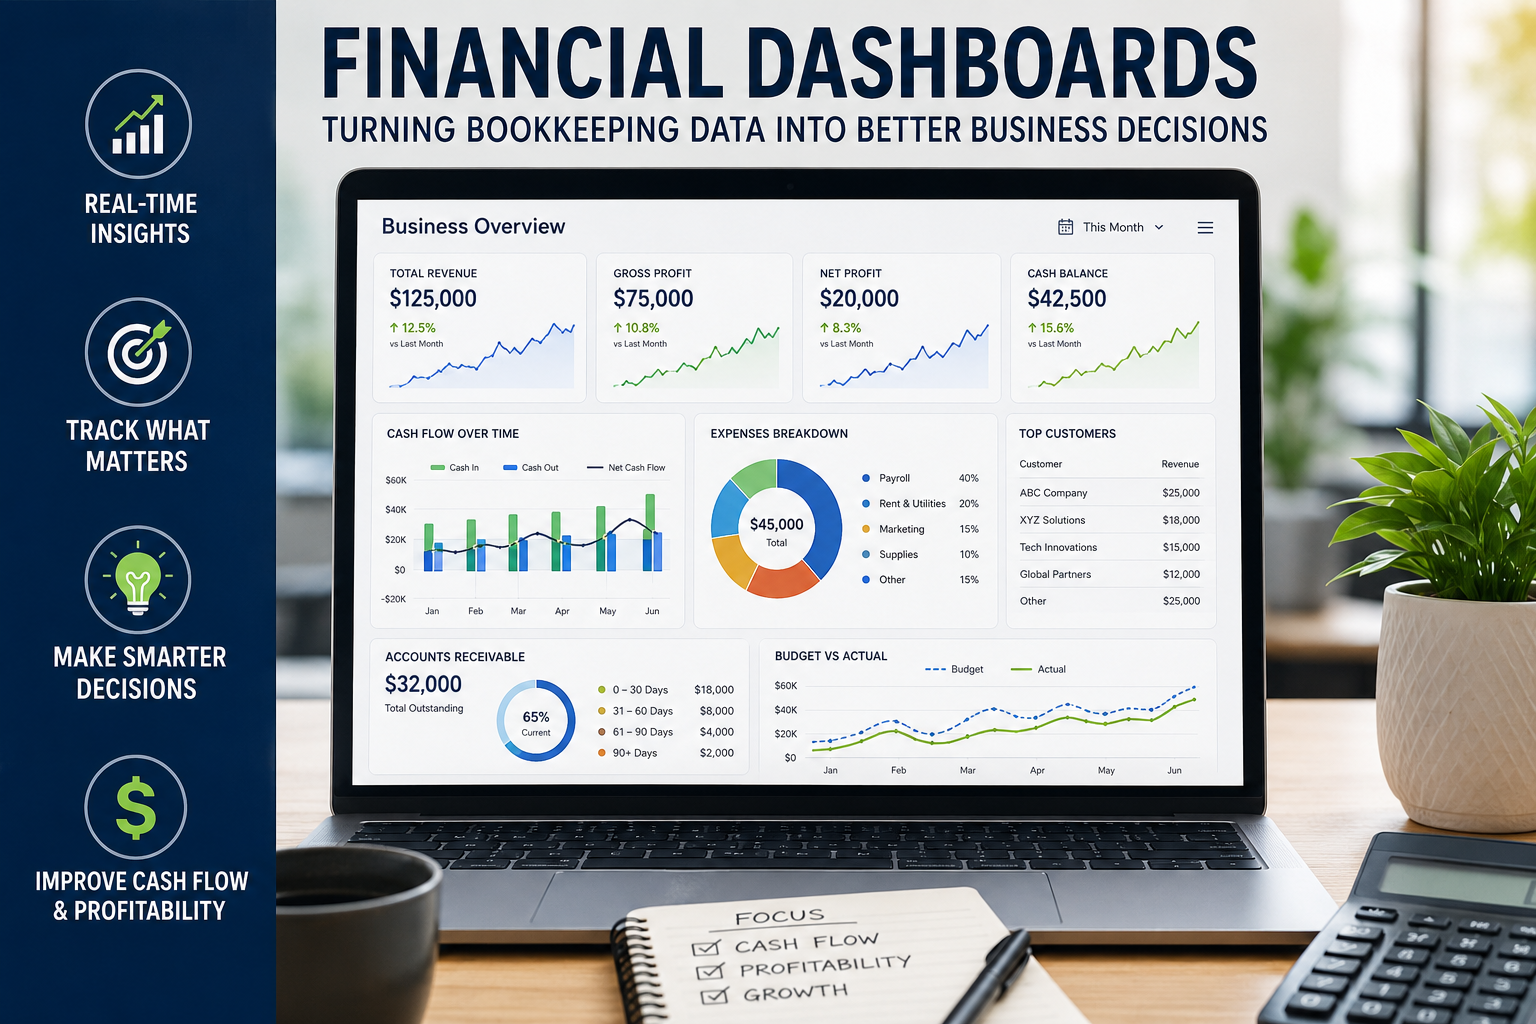
A properly designed financial dashboard transforms raw bookkeeping data into clear, actionable insights that help business owners understand performance, identify trends, and make smarter decisions faster.
As businesses grow, financial visibility becomes increasingly important. Without organized reporting systems, it becomes difficult to manage profitability, monitor expenses, track cash flow, or confidently plan for growth. Accurate bookkeeping and consistent financial reporting are foundational elements of long-term business success.
What Is a Financial Dashboard?
A financial dashboard is a visual reporting system that displays key financial metrics in one centralized location.
Instead of digging through spreadsheets or lengthy reports, dashboards allow business owners to quickly evaluate the health of their business at a glance.
A dashboard may include:
- Revenue trends
- Gross profit margins
- Net income
- Cash flow metrics
- Accounts receivable balances
- Expense breakdowns
- Payroll costs
- Budget vs. actual comparisons
- KPI tracking
- Sales performance
- Inventory performance
- Debt obligations
Think of it as the control panel for your business finances.
When your bookkeeping is accurate and updated consistently, dashboards provide real-time operational intelligence that supports better decision-making.
Why Most Small Businesses Struggle Financially
Many small businesses do not fail because they lack customers.
They fail because they lack visibility.
Common issues include:
- Not understanding profitability
- Overspending without realizing it
- Poor cash flow forecasting
- Slow collections
- Inventory inefficiencies
- Uncontrolled operational costs
- Delayed financial reporting
- Making decisions based on assumptions instead of data
Without organized financial systems, business owners often rely on instinct rather than measurable information.
This creates:
- Decision paralysis
- Reactive management
- Increased financial stress
- Unpredictable cash flow
- Difficulty scaling operations
Consistent bookkeeping and financial reporting help businesses maintain accurate records, improve cash flow management, and make informed operational decisions.
For more information on this topic see: The Small Business Expo – Basic Guide to Accounting for Small Business Owners by Zach Lezberg February 13, 2025
The Difference Between Reports and Dashboards
Traditional financial reports are important, but dashboards provide a more usable and strategic format.
Traditional Reports
Examples include:
- Profit & Loss Statements
- Balance Sheets
- Statements of Cash Flow
- General Ledgers
- Transaction Reports
These reports provide detailed information but often require interpretation.
Financial Dashboards
Dashboards simplify the information by presenting:
- Trends
- Comparisons
- Visual charts
- Alerts
- Performance indicators
- Summaries
This allows business owners to identify problems and opportunities much faster.
Key Financial Metrics Every Small Business Should Track
1. Revenue Growth
Revenue tracking shows whether your business is expanding, plateauing, or declining.
A dashboard should track:
- Monthly revenue
- Quarterly revenue
- Year-over-year growth
- Revenue by service line
- Revenue by customer segment
Monitoring growth trends helps businesses identify which products, services, or divisions generate the highest returns.
2. Gross Profit Margin
Revenue alone does not determine business success.
Profitability matters more.
Gross profit margin measures how much money remains after direct costs are removed.
Low margins may indicate:
- Underpricing
- Rising supplier costs
- Operational inefficiencies
- Excess labor expenses
Tracking gross margin trends can help businesses protect profitability before issues become severe.
3. Net Profit
Net profit reflects what the business actually keeps after all expenses are paid.
This metric helps owners evaluate:
- Financial sustainability
- Operational efficiency
- Expense management
- Growth viability
Many businesses generate strong revenue while remaining unprofitable due to excessive overhead or weak financial controls.
4. Cash Flow
Cash flow is one of the most critical metrics for any business.
A company can appear profitable on paper while still struggling financially if cash inflows and outflows are poorly managed.
Dashboards can track:
- Operating cash flow
- Upcoming obligations
- Accounts receivable aging
- Outstanding invoices
- Upcoming payroll liabilities
- Vendor payment schedules
Strong cash flow management is essential for maintaining business stability and supporting growth initiatives.
5. Accounts Receivable
Slow-paying customers can create major financial strain.
A dashboard should monitor:
- Outstanding invoice totals
- Average collection times
- Overdue accounts
- Customer payment patterns
This allows businesses to improve collections before cash flow becomes problematic.
6. Operating Expenses
Expense tracking helps businesses identify:
- Unnecessary spending
- Rising overhead
- Budget overruns
- Vendor cost increases
- Subscription waste
Expense visibility often uncovers hidden profit opportunities.
7. KPI Tracking
KPIs (Key Performance Indicators) align operational performance with business goals.
Examples include:
- Customer acquisition cost (CAC)
- Days sales outstanding (DSO)
- Labor cost percentage
- Average project profitability
- Inventory turnover
- Revenue per employee
Tracking KPIs consistently helps leadership teams focus on measurable improvement rather than assumptions.
How Financial Dashboards Improve Decision-Making
Faster Decisions
Instead of waiting until month-end reports are finalized, dashboards provide ongoing visibility.
This helps businesses:
- React faster
- Solve problems sooner
- Identify opportunities earlier
Better Budgeting
Dashboards allow businesses to compare:
- Budgeted performance
- Actual performance
- Historical trends
This improves forecasting accuracy and resource allocation.
Increased Accountability
When metrics are visible, teams become more accountable.
Departments can monitor:
- Expense targets
- Revenue goals
- Labor efficiency
- Project profitability
This creates clearer operational alignment.
Improved Strategic Planning
Financial dashboards help leadership teams evaluate:
- Hiring decisions
- Expansion opportunities
- Equipment investments
- Marketing ROI
- Pricing strategies
Better visibility leads to more confident decision-making.
Tools Commonly Used for Financial Dashboards
Several modern accounting and reporting tools help businesses create financial dashboards.
Popular options include:
- QuickBooks Online
- Xero
- Fathom
- Float
- Microsoft Power BI
- Google Looker Studio
- Tableau
These tools can integrate with bookkeeping systems to provide automated reporting and forecasting capabilities.
Common Mistakes Businesses Make With Dashboards
Using Inaccurate Data
A dashboard is only as reliable as the bookkeeping behind it.
Poor bookkeeping creates:
- Misleading reports
- Incorrect forecasts
- Bad decisions
Accurate bookkeeping remains the foundation of reliable financial reporting.
Tracking Too Many Metrics
Not every metric matters equally.
Too much information creates confusion.
Focus on metrics directly tied to:
- Profitability
- Cash flow
- Operational performance
- Growth objectives
Ignoring Trends
One month of data rarely tells the full story.
Dashboards become most valuable when businesses monitor trends over time.
Patterns often reveal:
- Seasonal fluctuations
- Declining margins
- Expense creep
- Sales slowdowns
- Operational inefficiencies
How Small Businesses Can Start Using Financial Dashboards
Step 1: Organize Your Bookkeeping
Before dashboards can provide value, financial records must be accurate and current.
This includes:
- Categorizing transactions correctly
- Reconciling accounts monthly
- Maintaining updated financial records
- Cleaning up bookkeeping issues
Step 2: Identify Key Metrics
Choose the metrics most important to your business model.
For example:
Service Businesses
- Labor utilization
- Revenue per employee
- Gross margins
Retail Businesses
- Inventory turnover
- Average transaction value
- Product margins
Contractors
- Job profitability
- Change order tracking
- Project cash flow
Step 3: Automate Reporting
Modern accounting systems can automate much of the reporting process.
Automation reduces:
- Manual errors
- Reporting delays
- Administrative workload
Step 4: Review Financials Consistently
Dashboards only help if they are reviewed regularly.
Best practice:
- Weekly operational review
- Monthly financial review
- Quarterly strategic review
Consistency leads to stronger financial awareness.
Final Thoughts
Financial dashboards help transform bookkeeping from a basic administrative task into a strategic business tool.
When financial information is organized, visible, and actionable, business owners gain the ability to:
- Improve profitability
- Strengthen cash flow
- Reduce inefficiencies
- Make smarter decisions
- Scale with confidence
Bookkeeping is not just about compliance or taxes.
It is about creating financial clarity.
And businesses with financial clarity make better business decisions.